Coverage
AIQ Login ↗

Capitalize on Gnosis's managerbase analytics

Research on the managed-futures industry, the managers we cover, and the account structures allocators use. Written to support better-informed allocation decisions.

Industry

What is a CTA? Cover showing the US registration framework. Schematic.INDUSTRYWhat is a CTA?A guide forallocatorsGnosis Research · Allocator IQSchematicCFTCFederal regulatorNFASelf-regulatory organisationCTAAdvises on futuresCPOOperates pooled vehiclesFCMHolds customer fundsIBIntroduces accountsregistration and membershipAllocator verifies status in NFA BASIC

What Is a CTA? A Guide for Institutional Allocators

What is a commodity trading advisor, who regulates it and what does it trade? A guide to CTAs, CPOs and FCMs, with the facts to verify before a first meeting.

Hedge Funds and Managed Futures in Allocator Portfolios. Cover.Small multiples comparing 2024 and 2026 shares of investors naming each hedge-fund strategy most prominent: long-short equity 43% to 54%, multi-strategy 12% to 14%, global macro 11% to 10%, CTA or managed futures 8% to 2%.INDUSTRYHedge fundsand managedfuturesGnosis Partners Research · Allocator IQMost prominent hedge-fund strategy, 2024 vs 2026Long-short equity43%202454%2026Multi-strategy12%202414%2026Global macro11%202410%2026CTA / managed futures8%20242%2026AIMA/Marex, Emerging Manager Survey 2026. Respondent shares.

Hedge Funds and Managed Futures in Allocator Portfolios

How large are hedge-fund allocations, and where do managed futures sit in allocator attention? Family-office, emerging-manager and allocator survey evidence from 2026.

How Pension Funds Allocate Compared with Family Offices. Cover.Dumbbell chart of pension-fund alternatives allocations by ranked size group, simple versus asset-weighted average: top 20 23.9% and 17.3%, 21 to 50 31.0% and 31.7%, 51 to 150 28.4% and 28.0%, 151 to 300 25.4% and 25.5%.INDUSTRYPension fundsand familyofficesGnosis Partners Research · Allocator IQPension alternatives by size group, %Simple averageAsset-weightedSimple / weighted1520253035Top 2023.9 / 17.321 to 5031.0 / 31.751 to 15028.4 / 28.0151 to 30025.4 / 25.5Thinking Ahead Institute / P&I, Global Top 300 Pension Funds, Sept 2026

How Pension Funds Allocate Compared with Family Offices

How do the largest pension funds allocate, and why do their figures stay separate from family-office data? Scale, asset mix, domicile and liabilities.

How Large Is the Managed-Futures Industry? Cover.Horizontal bars of BarclayHedge managed-futures industry asset estimates: $301.5 billion at year-end 2020, $364.78 billion at year-end 2025, $425.5 billion at Q1 2026 and $353.74 billion at Q2 2026.INDUSTRYHow large is themanaged-futuresindustry?Gnosis Partners Research · Allocator IQManaged-futures industry assets ($bn)Year-end 2020$301.5Year-end 2025$364.78Q1 2026$425.5Q2 2026$353.74BarclayHedge estimates; year-end 2020 as cited in an SEC filing.

How Large Is the Managed-Futures Industry?

How large is the managed-futures industry, and why do the quarterly estimates move so much? BarclayHedge figures, their limits and what AUM means in a futures programme.
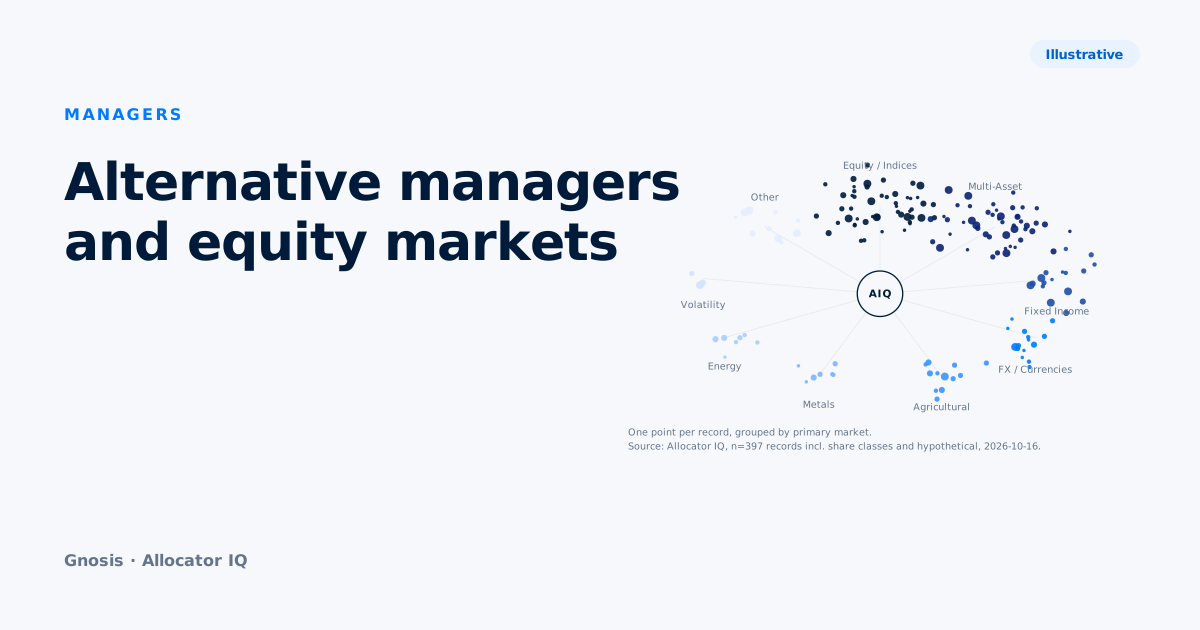
Managers

How to evaluate a CTA track record. Cover with a synthetic VAMI path. Illustrative.MANAGERSEvaluating aCTA trackrecordGnosis Research · Allocator IQIllustrativeHHypotheticalActual trading

How to Evaluate a CTA Track Record

Actual, proforma or hypothetical? A due-diligence framework covering the basis of the numbers, length of history, ratio limits, database biases and behaviour under stress.

Drawdown and recovery metrics explained. Cover with a synthetic underwater curve. Illustrative.MANAGERSDrawdown andrecoverymetricsGnosis Research · Allocator IQIllustrativePeakTroughRecoveryDrawdown from running peakDepth -18%

Drawdown and Recovery Metrics Explained

Maximum drawdown, time to recovery, Calmar, Sterling and the Ulcer index: what each measures, how it is calculated and which choices change the result.

Evaluating an Emerging Hedge-Fund Manager. Cover.Key-figure cover: 86% of investors cite operational diligence, administration or transparency concerns as an allocation barrier, against 83% in 2024.MANAGERSEvaluating anemergingmanagerGnosis Partners Research · Allocator IQALLOCATION BARRIER CITED BY INVESTORS86%cite operational diligence, administrationor transparency concerns83% in 2024AIMA/Marex, Emerging Manager Survey 2026

Evaluating an Emerging Hedge-Fund Manager

What matters beyond AUM and the length of the flagship record? Eligibility thresholds, allocation barriers, fees and timelines from AIMA/Marex's 2026 survey.

Emerging-Manager Fees, Alignment Terms and Vehicles. Cover.Staircase chart of emerging managers using alignment provisions: any listed provision 87%, high-water mark 80%, hurdle 36%, clawback 6%.MANAGERSFees, alignmentand vehiclesGnosis Partners Research · Allocator IQManagers using alignment provisions, %87%Any listedprovision80%High-watermark36%Hurdle6%ClawbackAIMA/Marex, Emerging Manager Survey 2026. Manager-reported.

Emerging-Manager Fees, Alignment Terms and Vehicles

What do emerging hedge-fund managers charge, which alignment terms do they use, and how do investors prefer to access them? Data from AIMA/Marex's 2026 survey.

How Allocators Find New Managers. Cover.Horizontal bars of sourcing channels among investors in emerging hedge funds: personal network 65% in 2024 and 40% in 2026; prime-broker capital introduction 22% in 2024 and 30% in 2026.MANAGERSHow allocatorsfind newmanagersGnosis Partners Research · Allocator IQWhere investors source emerging managersPersonal network, 202465%Personal network, 202640%Prime-broker capital introduction, 202422%Prime-broker capital introduction, 202630%AIMA/Marex, Emerging Manager Survey 2026, p. 36. Respondent shares.

How Allocators Find New Managers

Do allocators still find managers through their networks? Discovery channels, prime-broker capital introduction and the time from first meeting to allocation.
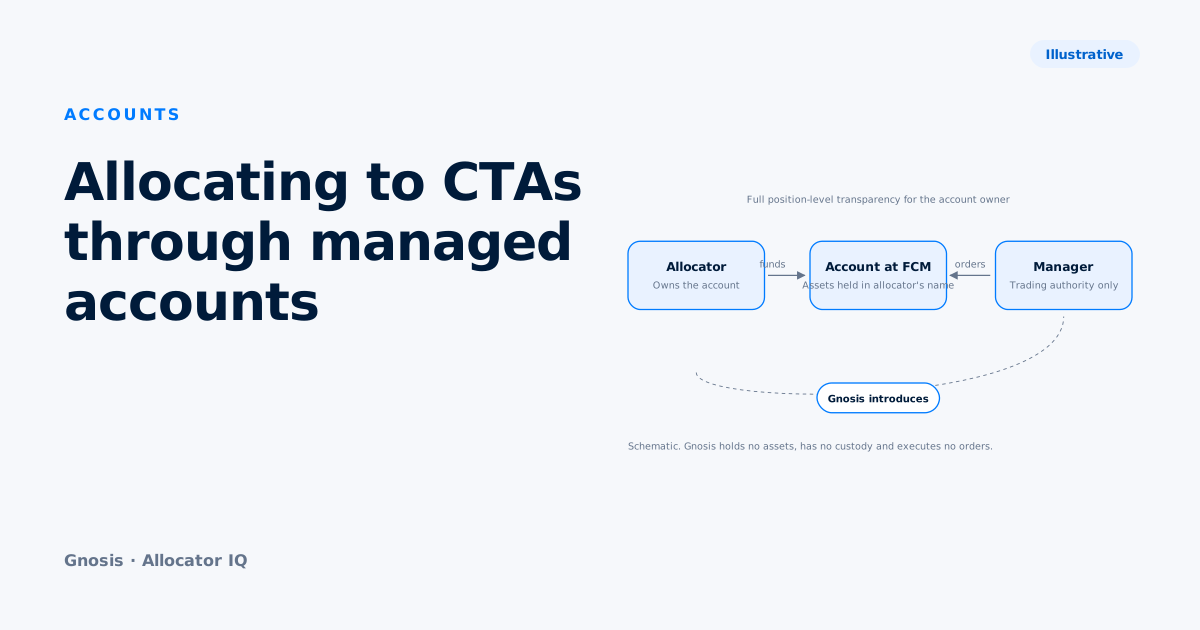
Accounts

Separately managed accounts versus fund investment. Cover with structure schematic. Schematic.ACCOUNTSSMAs versusfundinvestmentGnosis Research · Allocator IQSchematicPOOLED FUNDSEPARATELY MANAGED ACCOUNTAllocatorHolds units or LP interestFund vehicleOwns the assetsManagerTrades for the fundsubscriptiontradingAdministrator · auditor · brokerAllocatorOwns the accountAccount at FCMIn the allocator's nameManagerTrading authority onlyfundingordersDaily statements to the owner

Separately Managed Accounts vs Fund Investment

How does holding a managed-futures programme through a separately managed account differ from a fund? A point-by-point comparison of ownership, liquidity, liability, minimums and workload.

Choosing How to Access Alternative Investments. Cover.Stacked 100% bar of investors' preferred vehicle for emerging-manager access: commingled fund 66%, either 18%, SMA 16%.ACCOUNTSChoosing howto accessalternativesGnosis Partners Research · Allocator IQPreferred vehicle for emerging-manager access66%Commingled fund18%Either16%SMA0%50%100%AIMA/Marex, Emerging Manager Survey 2026

Choosing How to Access Alternative Investments

How do direct holdings, pooled funds, separate accounts and secondaries differ in the work they require? Survey evidence on sourcing, tickets and vehicle preferences.

Allocators

Inside the Family-Office Investment Portfolio. Cover.Donut chart of the reported global family-office allocation: public equities 30%, private equity 18%, fixed income 16%, cash 12%, real estate 12%, hedge funds 4%, private credit 2%; published entries total 98.2%.ALLOCATORSInside thefamily-officeportfolioGnosis Partners Research · Allocator IQReported global allocation, %98.2%published totalPublic equities30%Private equity*18%Fixed income16%Cash12%Real estate*12%Hedge funds4%Private credit2%Other categories* Direct plus fund. Citi Wealth, 2026/27 Global Family Office Report

Inside the Family-Office Investment Portfolio

What do family offices hold alongside public equities, bonds and cash? Citi's 2026/27 survey data by office size and region, and what the allocation figures exclude.

Liquidity in a Diversified Portfolio. Cover.Waffle grid of 100 squares showing surveyed allocators' 2026 intention for alternatives: increase 67%, maintain 26%, unsure 5%, decrease 2%.ALLOCATORSLiquidity in adiversifiedportfolioGnosis Partners Research · Allocator IQAlternatives intention for 2026, share of respondents67%Increase26%Maintain5%Unsure2%DecreaseiConnections, Global Allocator Report 2026. One square = 1%.

Liquidity in a Diversified Portfolio

How do allocators balance new commitments with redemptions and cash needs? Evidence on redemptions, cash holdings, liquidity terms and pension liabilities.

Private Credit After the Broad Growth Narrative. Cover.Diverging bars of family offices planning to decrease or increase credit exposure: private credit 22% decrease and 10% increase, high-yield 17% and 6%, emerging-market fixed income 14% and 8%, developed investment-grade 16% and 17%.ALLOCATORSPrivate creditafter the growthnarrativeGnosis Partners Research · Allocator IQFamily-office credit intentions, next 12 monthsDecreaseIncreaseDeveloped IG16%17%Private credit22%10%EM fixed income14%8%High-yield17%6%Citi Wealth, 2026/27 Global Family Office Report

Private Credit After the Broad Growth Narrative

Why has private-credit sentiment turned selective, and what do allocators want to understand? Family-office intentions and broader allocator views from 2026 surveys.

How Family-Office Portfolios Differ by Region. Cover.Dot plot of cash and fixed-income allocations by family-office location: Asia-Pacific 20% and 18%, EMEA 11% and 15%, Latin America 7% and 24%, North America 10% and 12%.ALLOCATORSFamily-officeallocationby regionGnosis Partners Research · Allocator IQAllocation by family-office location, %CashFixed income0510152025Asia-Pacific2018EMEA1115Latin America724North America1012Citi Wealth, 2026/27 Global Family Office Report. Region = office location.

How Family-Office Portfolios Differ by Region

How do family-office allocations and plans differ across Asia-Pacific, EMEA, Latin America and North America? Citi's 2026/27 data by office location.

What Family Offices Plan to Change in the Next 12 Months. Cover.Slope chart of published net intentions from the 2025 to the 2026 survey: developed equities +17 to +32, hedge funds +14 to +14, cash +4 to -6, digital assets -1 to -11, private credit +12 to -12.ALLOCATORSWhat familyoffices planto changeGnosis Partners Research · Allocator IQPublished net intention, percentage points2025 survey2026 surveyzeroDeveloped equities +32+17Hedge funds +14+14Cash −6+4Digital assets −11−1Private credit −12+12Citi Wealth, 2026/27 Global Family Office Report

What Family Offices Plan to Change in the Next 12 Months

What did family offices change last year, and what do they plan next? Net intentions, risk concerns, return targets and review thresholds from Citi's 2026/27 survey.

How Institutions Size a Trend-Following Allocation. Cover.Horizontal bars comparing a survey-derived average of 0.68% of institutional portfolios with published trend-following targets of 6% at SURS and 10% at the Hawaii EUTF.ALLOCATORSSizing atrend-followingallocationGnosis Partners Research · Allocator IQManaged futures or trend following, % of portfolioSurvey average, product of reported averages0.68%SURS policy target6%Hawaii EUTF policy target10%Natixis 2025; SURS FY2027; Hawaii EUTF June 2025.

How Institutions Size a Trend-Following Allocation

Why do survey averages put managed futures below 1% while some institutions target 6% or 10%? Natixis survey data and published SURS and Hawaii EUTF policies.

How Large Are Family Offices? Reading the Asset Estimates. Cover.Horizontal bars comparing single-family-office asset estimates: Deloitte $3.1 trillion across 8,030 offices, With Intelligence at least $4.67 trillion across 3,019 offices, and Deloitte's 2030 forecast of $5.4 trillion shown with a dashed outline.ALLOCATORSHow large arefamily offices?Gnosis Partners Research · Allocator IQSingle-family-office assets ($tn)Deloitte, 2024 (8,030 offices)$3.1tnWith Intelligence, Jan 2025 (3,019 offices)$4.67tnDeloitte forecast for 2030$5.4tnSeparate estimates with different methods. Dashed bar: forecast.

How Large Are Family Offices? Reading the Asset Estimates

Why do estimates of single-family-office assets range from $3.1 trillion to at least $4.67 trillion? What Deloitte and With Intelligence measure, and what they leave out.

How Family Offices Govern Their Investment Decisions. Cover.Horizontal bars of the share of family offices with each governance practice in place: periodic review 77%, investment committee 63%, robust due diligence 60%, investment policy statement 55%, risk-management framework 49%, third-party reporting software 47%.ALLOCATORSHow familyoffices governinvestmentGnosis Partners Research · Allocator IQGovernance practice in place, % of officesPeriodic review and rebalancing77%Investment committee63%Robust due-diligence process60%Investment policy statement55%Risk-management framework49%Third-party reporting software47%Citi Wealth, 2026/27 Global Family Office Report, p. 94.

How Family Offices Govern Their Investment Decisions

How many family offices have an investment committee, a policy statement or a formal risk framework? Citi's 2026/27 governance data by office size and region.

How Family Offices Are Using AI. Cover.Horizontal bars of family-office AI adoption stages: no adoption 19%, early adoption 40%, moderate adoption 30%, advanced adoption 10%, transformational 2%.ALLOCATORSHow familyoffices areusing AIGnosis Partners Research · Allocator IQAI adoption stage, % of family officesNo adoption19%Early adoption40%Moderate adoption30%Advanced adoption10%Transformational2%Citi Wealth, 2026/27 Global Family Office Report, p. 102.

How Family Offices Are Using AI

How far have family offices adopted AI, and where do they use it? Adoption stages, use cases and reported benefits, with investor views on manager AI use.

Turn research into allocation decisions.

Request access to screen, compare and monitor the managers behind the analysis.